دانلود مقاله مدل سازی پیش بینی عمق برشی پروفیل های شیار برش بر پایه توزیع گاوسی
چکیده
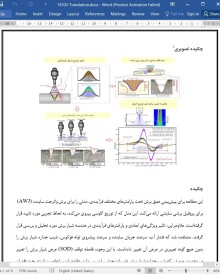
این مطالعه برای پیشبینی عمق برش تحت پارامترهای مختلف فرآیندی، مدلی را برای برش واترجت ساینده (AWJ) برای پروفیل برشی سایشی ارائه میکند. این مدل که از توزیع گاوسی پیروی میکند، به لحاظ تجربی مورد تایید قرار گرفتهاست. علاوهبراین، تاثیر ویژگیهای ابعادی و پارامترهای فرآیندی در هندسه شیار برش مورد تحلیل و بررسی قرار گرفت. مشاهده شد که فشار آب، سرعت جریان ساینده و سرعت پیشروی لوله فوکوس، شیب جداره شیار برش را بدون هیچ گونه تغییری در عرض آن تغییر دادهاست. با این وجود، فاصله توقف (SOD) عرض شیار برش را تغییر میدهد، در صورتی که شیب جداره شیار برش تغییرات جزئی را در پی دارد. علاوهبراین، رابطه بین انرژی جت (فوران آب)، عمق برش و عرض شیار برش، بر اساس مشتقگیری مرتبه اول پروفیل شیار برش به دست آمده مورد تحلیل و بررسی قرار گرفت. نتایج تجربی حاکی از آن است که: 1) بین عمق برش و کاهش توزیع انرژی جت یک رابطه خطی وجود دارد؛ 2) انرژی جت در قسمت لبه بالا و پایین شیار برش، از کمترین میزان توزیع برخوردار است. مدل پیشبینیکننده عمق برش و توزیع انرژی جت، متعاقباً امکان بهینهسازی پارامترهای فرآیندی در فرآیند AWJ را فراهم میآورد.
1. مقدمه
ماشینکاری سایشی با واترجت(AWJ) از زمانی که به عنوان یک فنآوری پردازش همهکاره و نوظهور برای خنک کردن دستگاه مورد استفاده قرار گرفته، به دلیل مزایای خارقالعادهای که نسبت به انواع سنتی فنآوریهای ماشینکاری دارد مورد تحسین و توجه قرار گرفتهاست و انتظار میرود که برای نسل بعدی فنآوریهای پردازش کم هزینه (1)، پر بازده (2) و فاقد آلودگی (3) موفقیتآمیز بوده و بسیار نویدبخش باشد. با این وجود، توزیع انرژی و عمق برش از جمله پارامترهای ماشینکاری در AWJ هستند که از دقت بالایی برخوردارند. در کاربردهای عملی، عمق برش دقیق و کنترلپذیر موضوعی است که بسیار مورد توجه قرار دارد.
مدل عمق برش از دیدگاههای مختلف توسط چند تن از محققان بطور گستردهای مورد مطالعه قرار گرفتهاست. تحقیقات پیشین که فرآیندهای سایشی را مورد بررسی قرار دادهاند، یک مدل ریاضی را با استفاده از مدل فرسایش و خرابی ناشی از ضربه به منظور توسعه بیشترین عمق برش اتخاذ کردهاند (4). Huang و همکاران (5) یک مدل فرسایش اصلاحشده را با استفاده از حفاری سینماتیکی با جریان جت جامد برای پیشبینی عمق برش بر مبنای روشهای مختلف تحلیل و فرسایش در امتداد شیار برش پیشنهاد کردند. Paul و همکاران (6) مفهوم یک شکل کلی از شیار برش را توسط AWJبرای توسعه عمق کلی برش معرفی کردند که در آن افزایش عمق برش و عرض امتداد شیار برش لحاظ شدهاست. Mohankumar و همکاران (7) از پارامترهای فرآیندی اصلاحشده برای بهدست آوردن نقطه پیک عمق برش استفاده کردند و سپس به کمک قضیه باکینگهام یک معادله نیمه تجربی را ارائه کردند. Niranjan و همکاران (8) با استفاده از پروفایل پروژکتور یا سایهنگار نوری، عمق برش را برای بررسی تاثیر پارامترهای فرآیندی به صورت تجربی و نظاممندی تعیین کردند. Ketan و همکاران (9) با آزمایش آلیاژ AA2014 یک عمق برش را با استفاده از روش منطق فازی پیشبینی کردند. به تازگی، عمق برش و زبری سطح را نیز مورد بررسی قرار دادهاند. Ozcelik و همکاران (10) از انواع مختلفی از پارامترهای برش استفاده کردند تا منحنی برشپذیری آباک را برای پیشبینی زبری سطح و عمق برش ایجاد نمایند. Aydin و همکاران (11) قابلیت ماشینکاری گرانیت را با استفاده از آرایه متعامد Taguchi برای مرتبط ساختن عمق برش با ناحیه فرسایی برشی مورد بررسی قرار دادند. Nie و همکاران (12) برای تحلیل و بررسی ویژگیهای توپوگرافی و مکانیسمهای تشکیل سطوح برش، به بررسی تاثیر سطوح مختلف فشار آب بر عمق برش پرداختند. Yuvaraj و همکاران (13) با توجه به تغییرات زاویه فرسایش، اثر آن بر کیفیت ماشینکاری و عمق برش را مورد تحلیل و بررسی قرار دادند. Aydin و همکاران (14) یک مطالعه تجربی را برای ارزیابی فرآیند برش، زبری سطح، عمق برش و زاویه شیار برش گرانیت اجرا کردند.
5. نتیجهگیری
این مطالعه با توجه به فرآیند فرسایش مواد شکلپذیر، یک مدل ریاضی از عمق برش را ارائه کردهاست که در آن انرژی جت با پیروی از تابع گاوسی توزیع میشود. این مدل تحلیلی، تغییر در عرض شیار برش را به دنبال عمق برش از طریق تغییر شکل پلاستیکی و ریز برش و با استفاده از توزیع گاوسی مورد تحلیل و بررسی قرار میدهد. علاوهبراین، مشتقگیری جزئی مرتبه اول برای تحلیل و بررسی توزیع انرژی جت و روند کاهشی جت آن در مدل پیشبینی پروفیل عرض شیار برش و عمق برش انجام شد. این مطالعه به شرح زیر جمعبندی میشود:
(1) پروفیلهای شیار برش مانند باینریسازی و پرسازی تصویر، از طریق پردازش تصاویر دیجیتال و تحلیل آماری ساختار و شکل سطحی آنها توصیف میشوند. پروفیلهای بهدست آمده با استفاده از روش تقریب مرحله به مرحله برازیده شدند. این روش تقریب مرحله به مرحله برای پروفیلهای شیار برش، تا حد زیادی به پروفیلهای پیشبینی شده وابسته است.
(2) مدل ریاضی به همراه توزیع گاوسی عرض و عمق برش جت، تغییرات موجود در اترژی جت و زاویه فرسایش آن را در عمقهای مختلف برش طی انجام ریزماشینکاری محاسبه میکند. ضرایب همبستگی بین مقادیر آزمایشی و پیشبینی شده برای آلیاژ آلومینیوم 6061، Ti6Al4V و فولاد ضد زنگ گرید 304، به ترتیب 0.9643، 0.9753 و 0.9912 هستند که به همبستگی بالای بین مقادیر آزمایشی و پیشبینی شده اشاره دارند.
(3) با توجه به مشتقگیری جزئی مرتبه اول پروفیل شیار برش، میتوان مشاهده کرد که شیبهای پروفیل شیار برش متفاوتی در عرضهای مختلف پروفیل وجود دارد. در لبه بالا و پایین شیار برش، شیب پروفیل در کمترین حد و نزدیک به صفر است، در حالیکه در لبه بالا و پایین شیار برش، شیب پروفیل افزایش مییابد و سپس رو به کاهش میگذارد، که این امر حاکی از آن است که انرژی پلوم جت در لبه و پایین لبه دارای کمترین مقدار است در صورتیکه داخل پروفیلهای شیار برش از بالاترین مقدار برخوردار است.
Abstract
This study proposes a model for the erosion cutting profile to predict the cutting depth under different process parameters for abrasive waterjet (AWJ) cutting. The model follows the Gaussian distribution and is experimentally validated. Additionally, the effects of the dimensional characteristics and process parameters on the kerf geometry were analyzed. It was found that the water pressure, abrasive flow rate, and focusing tube traverse speed changed the slope of the kerf wall without changing the kerf width. However, the standoff distance (SOD) changes the kerf width, whereas the slope of the kerf wall induces minor changes. Furthermore, based on the first-order derivation of the extracted kerf profile, the relationship between jet energy, cutting depth, and kerf width was analyzed. The experimental results revealed that: 1) the relationship between the reduction in the jet energy distribution and cutting depth is non-linear; 2) the jet energy distribution is smallest at the kerf top edge and bottom section. The predictive cutting depth model and jet energy distribution will enable the subsequent optimization of process parameters in the AWJ process.
1. Introduction
Since its inception as an emerging versatile and cool-machine processing technology, abrasive waterjet (AWJ) machining has been acclaimed for its extraordinary advantages over traditional machining technologies and holds great promise for the next generation of low-cost [1], high-efficiency [2], and pollution-free processing technologies [3]. However, the cutting depth and energy distribution are high-precision machining parameters in AWJ. For practical applications, controllable and precise cutting depths are a topic of great interest.
The cutting depth model has been widely studied by several researchers from various perspectives. Previous research exploring erosive processes adopted a mathematical model using the erosion model and impact damage to develop the maximum cutting depth [4]. Huang et al. [5] developed a modified erosion model using kinematic jet-solid penetration to predict the cutting depth based on different erosion methods along the kerf. Paul et al. [6] introduced the concept of a generalized kerf shape by AWJ to develop the total cutting depth, which considers the along-kerf width and increasing cutting depth. Mohankumar et al. [7] used modified process parameters to attain the peak cutting depth and develop a semi-empirical equation using Buckingham’s theorem. Niranjan et al. [8] experimentally and systematically determined the cutting depth using a profile projector to investigate the effects of process parameters. Ketan et al. [9] experimented with an AA2014 alloy to establish a predictive cutting depth using a fuzzy-logic technique. Recently, surface roughness and cutting depth have also been studied. Ozcelik et al. [10] used different cutting parameters to develop a cuttability abacus to predict the cutting depth and surface roughness. Aydin et al. [11] investigated the machinability of granite to relate the cutting depth to the cutting wear zone using a Taguchi orthogonal array. Nie et al. [12] studied the effect of different water pressures on the cutting depth to analyze the topographic characteristics and formation mechanisms of the cut faces. Yuvaraj et al. [13] used the variation in the erosion angle to analyze its effect on the cutting depth and machining quality. Aydin et al. [14] conducted an experimental investigation to evaluate the cutting process, cutting depth, surface roughness, and kerf angle of granite.
5. Conclusion
This study proposes a mathematical model of cutting depth based on the ductile material erosion process, in which the jet energy distribution follows a Gaussian function. This analytical model analyzes the change in kerf width following the cutting depth through micro-cutting and plastic deformation, which is explained using a Gaussian distribution. In addition, first-order partial derivatives of the profile prediction model of the cutting depth and kerf width were performed to analyze the distribution of jet energy and its jet decline process. The study is summarized as follows:
(1) Kerf profiles, such as binarization and image filling, are characterized by digital image processing and statistical analysis of their surface morphology. The extracted profiles were profile-fitted using a stepwise approximation. The stepwise approximation of the kerf profiles strongly corresponds to the predicted profiles.
(2) Combined with the Gaussian distribution of the jet cutting depth and width, the mathematical model calculates variations in the erosion angle and jet energy at different cutting depths during micromachining. The correlation coefficients between the experimental and predicted values of the aluminum 6061 alloy, 304 stainless steel, and Ti6Al4V are 0.9643, 0.9912, and 0.9753, respectively, which shows that the predicted value is highly correlated with the experimental value.
(3) Based on the first-order partial derivatives of the kerf profile, it is clear that the slopes of the kerf profile vary at different profile widths. At the kerf top edge and bottom, the slope of the profile is the smallest and close to zero, whereas at the kerf top edge and bottom, the slope of the profile increases and then decreases, which verifies that the energy of the jet plume is the lowest at the edge and bottom of the kerf, whereas the energy is the highest within the kerf profiles.
نکات مهم
چکیده تصویری
چکیده
1. مقدمه
فهرست اصطلاحات
2. رویکرد تحلیلی
3. راه اندازی به صورت تجربی
3.1. مواد
3.2. روند آزمایش و تحلیل و بررسی
4. نتیجه و بحث
4.1. درستییابی مدل
4.2. تحلیل و بررسی توزیع انرژی جت
5. نتیجهگیری
منابع
Highlights
Abstract
Graphical abstract
Nomenclature
1. Introduction
2. Analytical approach
3. Experimental setups
3.1. Materials
3.2. Experimental procedure and analysis
4. Result and discussion
4.1. The model verification
4.2. Analysis of the jet energy distribution
5. Conclusion
References
این محصول شامل پاورپوینت ترجمه نیز می باشد که پس از خرید قابل دانلود می باشد. پاورپوینت این مقاله حاوی 16 اسلاید و 5 فصل است. در صورت نیاز به ارائه مقاله در کنفرانس یا سمینار می توان از این فایل پاورپوینت استفاده کرد.
در این محصول، به همراه ترجمه کامل متن، یک فایل ورد ترجمه خلاصه نیز ارائه شده است. متن فارسی این مقاله در 6 صفحه (1500 کلمه) خلاصه شده و در داخل بسته قرار گرفته است.
علاوه بر ترجمه مقاله، یک فایل ورد نیز به این محصول اضافه شده است که در آن متن به صورت یک پاراگراف انگلیسی و یک پاراگراف فارسی درج شده است که باعث می شود به راحتی قادر به تشخیص ترجمه هر بخش از مقاله و مطالعه آن باشید. این فایل برای یادگیری و مطالعه همزمان متن انگلیسی و فارسی بسیار مفید می باشد.
بخش مهم دیگری از این محصول لغت نامه یا اصطلاحات تخصصی می باشد که در آن تعداد 40 عبارت و اصطلاح تخصصی استفاده شده در این مقاله در یک فایل اکسل جمع آوری شده است. در این فایل اصطلاحات انگلیسی (تک کلمه ای یا چند کلمه ای) در یک ستون و ترجمه آنها در ستون دیگر درج شده است که در صورت نیاز می توان به راحتی از این عبارات استفاده کرد.
- ترجمه فارسی مقاله با فرمت ورد (word) با قابلیت ویرایش و pdf بدون آرم سایت ای ترجمه
- پاورپوینت فارسی با فرمت pptx
- خلاصه فارسی با فرمت ورد (word)
- متن پاراگراف به پاراگراف انگلیسی و فارسی با فرمت ورد (word)
- اصطلاحات تخصصی با فرمت اکسل


