
دانلود رایگان مقاله ارزیابی قابلیت اطمینان با توربین های بادی و پانل های فتوولتائیک
چکیده
استقرار انرژی های تجدید پذیر در شبکه میتواند در قابلیت اطمینان و امنیت آنها تاثیر بگذارد. در این مقاله یک روش ارزیابی قابلیت اطمینان در حضور توربین های باد و پانل های فتوولتائیک با IEEE-RBTS نشان داده شده است که این سیستم انتخاب شده برای مطالعه می باشد. منابع تمیز جمع شده در واقع نقاط بار در پیکربندی شبکه میکرو را تغذیه می کند. استفاده ازروش های تحلیلی برای ارائه اطلاعات جزئی از شاخص های قابلیت اطمینان و در نظر گرفتن ویژگی ها ، با توجه به این واقعیت است که ویژگی های تصادفی انرژی های تجدید پذیر به طور کامل در نظر گرفته نمی شود. بنابراین، یک روش شبیه سازی مونت کارلو به منظور دستیابی به اعمال تجزیه و تحلیل دقیق از عملکرد قابلیت اطمینان سیستم نمونه در مدت زمان معین به کار گرفته می شود. تنوع منابع تجدید پذیر، تناوب، تناوب و تقاضا توزیع ، همه در نظر گرفته می شود. این موضوع که به تفصیل شرح داده شده است و ترکیبی از محدودیت در شبکه می باشد که از طریق یک الگوریتم کامپیوتری اختصاصی طراحی شده توسط نویسندگان ارائه شده است که در این مقاله امکان پذیر می باشد.
1. نامگذاری
SAIFI - شاخص فرکانس وقفه متوسط سیستم
SAIDI – شاخص مدت وقفه متوسط سیستم
EENS - انرژی مورد انتظار تامین نشده است
ASAI - میانگین شاخص در دسترس بودن سیستم
IEB، ICB - منفعت انرژی قطع شده، سود هزینه
DG - نسل توزیع شده
2. مقدمه
با ظهور DG انرژی های تجدید پذیر، آن را به صورتی که مجددا قابلیت اطمینان داشته باشد و این قابلیت را به هموراه ثبات به چالش بکشد تبدیل کرده است. 1 جریان برق دو طرفه در سیستم های توزیع به ناچار به عنوان DG های نزدیک تر به به بار نقطه ایی در نظر گرفته می شوند.از این رو، شرکت های ابزاراقدامات نوسازی و بازسازی فرآیندهای نسبت به شبکه فعال و مفاهیم شبکه هوشمند به کار بسته اند که به توزیع پیشرفته می پردازد و سیستم های مدیریت نیز به حداکثر رساندن مصرف کننده با کیفیت انرژی و در دسترس بودن اقدام می کنند، در نتیجه شبکه هایشان به شرایط به حالت تقاضای جدید سازگار تر می باشد. به تبع آن، ابزار ارزیابی نیاز به رسیدگی عملیات پیش بینی شده اضافی دارد که پیچیدگی سطح عملیات را یالا می برد. های تحلیلی قابلیت اطمینان محدود می باشند واین محددودیت شامل در نظر گرفتن محدودیت های عملیاتی به طور کامل، به عنوان مثال طبیعت تصادفی تجدید پذیر منبع قدرت DG، تقاضای پویا ، طرح بار ، محل توزیع انرژی، و دیگرموارد که از اهمیت بسزایی برخوردار می باشد. با این حال، روش های جدیدتر ارزیابی و الگوریتم های شبیه سازی کامپیوتری باید ویژگی های دارایی واقعی و حالت های دستکاری عملیاتی مهمی به منظور تنوع مدل داشته باشد که شامل تناوب، تناوب غیر خطی می باشد که این ویژگی به طور کامل باید معین شود.چندین طرح ارتقا و روشهای عددی برای ارزیابی قابلیت اطمینان توسعه یافته اند. در [2] یک مسیر حلقه انتخاب کاهش بار نامتعادل معرفی شده است که به حداقل رساندن تلفات میپردازد، در[3] مجموعه حداقل با شبکه های دیگر برای مدار پیشنهادی شناسایی مجموعه ای حداقل مقدار انرژی معرفی شده است. نتایج به دست آمده که وصفشان گفته شد، برای مقایسه آنلاین از طرح های شبکه های جایگزین مناسب هستند. سیستم شاخص هایی که دارای قابلیت اطمینان معینی باشند دارای امترهای تجزیه و تحلیل مناسبی هستند که برای توجیه گزینه های سرمایه گذاری مناسب می بانشد. برخی از روش های مقایسه ایی دارای درجه بهبودی ترکیب جایگزین سیستم DGدر حالت مشخصی می باشند [4] و یا شبکه میکرو پیکربندی [5] ازارزیابی اقتصادی و ارزش هزینه انرژی و ضرر و زیان های پولی [6] را مشخص می کند. آستانه ظرفیت DG فراتر از آن است که هیچ کمک معناداری در بر داشت وجود ندارد[7] با استفاده از IEB و ICB. با این وجود، مطالعات دقیق درخواست پیش بینی تقاضا به روز شده و گزارش توسعه ملی به حمایت از اعتبار نتایج و صحت نتایج انجام می شود. شبیه سازی مونت کارلو [8] - [11] به طور گسترده استفاده می شود ونتایج تجزیه و تحلیل آنها قابلیت اطمینان پیچیده ایی دارد. آن را می توانید به صورت چند حالته برسی کرد که فرآیندهای تصادفی، و مدل های احتمالی از آن جمله اند؛ از این رو آن در این مقاله انتخاب کرده ایم. 11و12اتوماسیون و حفاظت سیستم ها کاملا قابل اعتماد می باشد که برای موارد طراحی مهم و ضروری می باشند. بخش سوم توصیف قدرت خروجیمی باشد DG، که شامل تقاضا وطراحی مدل می باشد. شبیه سازی مونت کارلو روش می باشد که در بخش چهارم توضیح داده شده است. در بخش پنجم، اثر یکپارچه سازی تجدید پذیر DG بر روی قابلیت اطمینان IEEE-RBTS سیستم در دو سناریو مختلف مورد ارزیابی قرارگرفته است. داداهای باد از فرودگاه ST032040 Townsville و تشعشعات خورشیدی از ST039083 Rockhampton در ایالت کوینزلند استرالیا حمع شده است. ودر پایان نتایج در بخش 5 جمع بندی شده ایت.
3. مدلهای اجزاء
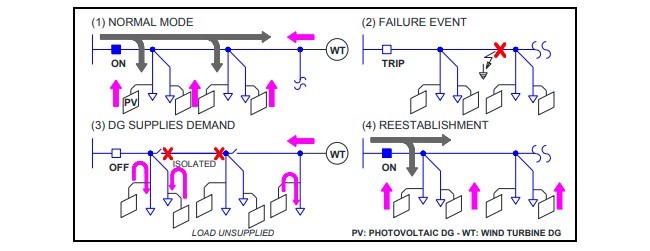
مدل IEEE–RBTS در کارهای قبلی به شدت مورد استفاده قرار گرفته است. 12 با این وجود، سیستم های تجدید پذیر DG متوسط به طور مستقیم در سطح ولتاژ 11KV به کار گرفته می شوند. که این مدل ساده از پیکربندی شبکه میکرومی باشد که در شکل نشان داده شده است. 1. اندازه DG ها وسعتی از 200KW تا 3000kW، به عنوان تجاری در دسترس می باشند را در بر می گیرد که در عمل آن را می توان به عنوان زیر مشخص کرد:
• در حالت عادی، منبع اصلی تقاضا های سیستم را ارضاع می کند. انرژی DG به صورت محلی مصرف می شود، هر DG قدرت مازاد تبدیل به شبکه اصلی را دارد.
• در یک رویداد شکست، بخش خط معیوب و یا توزیع کننده جدا شده و تقاضای بار فعال (کل یا قسمتی) توسط انرژی DG ها در دسترس قرار می گیرد. همه شکست به عنوان اتصال کوتاه در نظر گرفته می شود، و این در حالی است که فیوز جانبی ضربه در یک رویداد ثابت می ماند.[13].
• پس از پاکسازی خطا، این سیستم دوباره به حالت طبیعی باز میگردد. DG ها به صورت سوئیچ برای پیوستن به شبکه اصلی می باشند.
پروفایل های مصنوعی تاریخ برای تمام سیستم تولید می شود .شامل اجزای پایه و تنظیمات معین می باشد که درشکل 2 نشان داده شده است. در مورد DG ها تجدید پذیر، سری های زمانی مدل های توسعه یافته برای تعریف ST032040 و ST039083 درسایت های استرالیا سرعت باد مشخص را نشان می دهد و تابش خورشیدی الگوهای معینی را نشان می هد که پروفیل قدرت محاسبه شده را در حالت کلی معین می کند.
Abstract
Deployment of renewable energies in networks can affect their reliability and security. This paper presents a reliability evaluation methodology in the presence of wind turbines and photovoltaic panels illustrated with IEEE-RBTS system chosen for study. The aggregated clean resources feed load points in micro grid configuration. The use of analytical methods provide partial information of reliability indices attributes due to the fact that stochastic characteristics of renewable energy are not thoroughly considered in the traditional radial topology. Thus, a Monte Carlo technique with state duration sampling simulation is applied in order to achieve a detailed analysis of reliability performance of the system. Renewables variability, periodicity, intermittency and typical distribution demand are also considered. This elaborated combination of constraints in the network is possible through the use of a dedicated computer algorithm developed by the authors and presented in this paper.
I. NOMENCLATURE
SAIFI – System Average Interruption Frequency Index
SAIDI – System Average Interruption Duration Index
EENS – Expected Energy Not Supplied
ASAI – Average System Availability
Index IEB, ICB – Interrupted Energy Benefit, Cost Benefit
DG – Distributed Generation
II. INTRODUCTION
With the advent of renewable energy DG, it is important to reinvestigate reliability and stability under challenging scenarios [1]. Bidirectional power flow in distribution systems stands inevitably as DGs are connected closer to load points. Hence, utility companies face modernization and restructuring processes towards active network and smart grid concepts adoption supported by execution of advanced distribution and outage management systems to maximize consumer’s benefits, energy quality and availability, thus adapting their networks to novel demanding conditions. Consequently,evaluation tools need to handle additional foreseen operation level complexities. Reliability analytical methods are limited in considering these operational constraints completely, i.e. stochastic nature of renewable DG power source, dynamic demand, load shedding schemes, distributed energy location, and others of uttermost importance. However, newer assessment methods and computer simulation algorithms should manipulate realistic assets features and modes of operation in order to model variability, periodicity, intermittency and non-linear characteristics completely. Several upgrading schemes and numerical methods for reliability evaluation have been developed. In [2] a loop path selection alleviates imbalanced load and minimize losses, in [3] minimal tie sets with Petri nets is proposed for circuit minimal tie set identification. The results obtained are suitable for offline comparison of alternative network designs. System reliability indices specify analysis parameters for proper justification of investment options. Some approaches compare the degree of improvement incorporating alternate DG system in island mode [4] or micro grid configuration [5] and others perform economic and worth assessment of energy cost and monetary losses [6]. DG capacity thresholds beyond which there are no significant reliability contributions are found in [7] using IEB and ICB. Nevertheless, accurate studies request updated demand forecasts and national development reports to support the validity of results and correctness of conclusions. Monte Carlo simulation [8]-[11] has been extensively used for complex reliability analysis. It can handle multistate components, stochastic processes, and probabilistic models; hence it is chosen in this paper. Chronological Monte Carlo is selected due to its capacity in building sequential transitions processes through assets synthetic history profiles generation [11]. In this study, IEEE-RBTS network [12] accommodates stand-alone DG, i.e. wind turbines and photovoltaic panels in micro grid configuration. The service connections proposed assume a fully reliable automation and protection systems for switching events. Section III describes DG output power, demand and assets models. The Monte Carlo simulation method is explained in Section IV. In Section V, the effect of integrating renewable DG on the reliability of IEEE-RBTS system is evaluated in two different scenarios. Wind speed historical data of meteorological station ST032040 Townsville Airport and solar radiation from ST039083 Rockhampton Airport in Queensland State, Australia, have been utilized in this study. Finally, results have been discussed in Section VI and conclusions are summarized in Section VII.
III. COMPONENTS MODELS
IEEE–RBTS network has been extensively investigated in reliability studies [12]. Nevertheless, medium sized renewable DG systems have been directly added at 11kV voltage level in simple micro grid configuration, as shown in Fig. 1. DGs sizes range from 200kW up to 3000kW, as available commercially. Its operation can be outlined as below:
• At normal mode, main supply matches the system demand; DG energy is consumed locally, any DG surplus power turns to main grid.
• On a failure event, the faulty line section or distributor is isolated and enabled load demand (total or partial) is assisted by available DGs energy. All failures are considered as short-circuits, lateral fuses blow on a trip event, and disconnect isolators provide reclosing actions under load transfers [13].
• After clearing the fault, the system is reestablished to the normal mode state. DGs switch to join main grid again.
Artificial history profiles are generated for all the system components in the base case and assisted configurations shown in Fig. 2. In the case of renewable DGs, time series models are developed to define the ST032040 and ST039083 Australian sites specific wind speed and solar radiation patterns and calculate power profiles. A dynamic load model considering diversity, forecast and typical profiles resemble realistic demand projections.
چکیده
1. نامگذاری
2. مقدمه
3. مدلهای اجزاء
A. مدل سرعت باد و خروجی توربین بادی
B. مدل تابش خورشیدی و خروجی پانل های فتوولتائیک
.C بار توزیع و مدل تقاضای
.D دارایی های برق و مدل های اجزای
.E قطع مدل هزینه های انرژی
4. شبیه سازی مونت کارلو
5. نمونه مورد بررسی
.A نمونه اول -یکی توربین بادی در پایان هر فیدر
.B مورد 2- توربین های بادی در هر توزیع جانبی
6. بحث وبرسی
7. نتیجه گیری
منابع
Abstract
2. INTRODUCTION
3. COMPONENTS MODELS
A. Wind speed model and wind turbine output
B. Solar radiation model and photovoltaic panel output
C. Distribution load and demand model
D. Electrical assets and components models
E. Interrupted energy cost model
4. MONTE CARLO SIMULATION
5. CASE STUDIES
A. Case I - One wind turbine at the end of each feeder
B. Case II –Wind turbines at every lateral distributor
6. DISCUSSION
7. CONCLUSION
REFERENCES