
دانلود رایگان مقاله مشخصه رفتاری تقسیم بندی تصویر جمعیت
1. معرفی
پلت فرم های برون سپاری افراد و شرکت ها را قادر می سازد تا به سرعت جمع آوری مقادیر زیادی از ورودی انسانی را انجام دهند. چالش این است که چگونه به نتایج حاصل از افراد غیرفعال از طریق محتوا اعتماد کنیم. کار ما سهمی از تحقیق روزافزون در مورد چگونگی موفقیت گروه های بزرگ جمعیت افراد غیر رسمی برای جمع آوری نتایج تفسیر تصاویر با کیفیت بالا است. در سراسر زمینه های مختلف، روش هایی برای کنترل کیفیت نتایج و به حداقل رساندن خطاهای انسانی پیشنهاد شده است. در میان آنها می توان دو دسته اصلی را مشاهده کرد. اولین دسته روش هایی برای طراحی وظیفه crowdsourcing مناسب است. به شرایط مناسب کاربران بالقوه، با استفاده از سرنخ های تصویری مناسب و دستورالعمل های جامع برای جلوگیری از ابهام، و نشان دادن مثال های خوب و بد نتیجه مورد نظر نیاز است، درخواست کنندگان می توانند شانس خود را برای به دست آوردن پاسخ های با کیفیت بالا از جمعیت افزایش دهند. دسته دوم روش های کنترل کیفیت می تواند در زمان اجرا مورد استفاده قرار گیرد. تکنیک های مورد مطالعه در این دسته عبارتند از: بررسی تخصصی دامنه و استفاده از انفصال، که در آن نتایج چند جمعیت به یک نتیجه نهایی می پیوندد. ناحیه کمتر تحقیق شده چگونگی استفاده از دانش در مورد رفتار کاربر برای ارزیابی نتیجه نهایی است.
اطلاعات جمع آوری شده برای حل وظایف دیداری رایانه ای مورد استفاده قرار گرفته است. تمرکز کار ما این است که مرزهای اشیاء در تصاویر (تقسیم بندی)، که یک گام بحرانی است برای بسیاری از وظایف دیداری کامپیوتر، از جمله جمع آوری اطلاعات در مناطق موردنظر، تطبیق اشیاء در تصاویر مختلف (ثبت نام)، دنبال کردن اشیاء (ردیابی)، و تمایز بین انواع مختلف اشیاء (طبقه بندی) را مشخص کند.
محتوای تصویر می تواند رفتار کاربر و کیفیت حاشیه نویسی های به دست آمده را تحت تاثیر قرار دهد - کاربر ممکن است زمان بیشتری برای رسم کردن مرزهای شیئ پیچیده، مانند مرز یک گل در مقابل جعبه نیاز داشته باشد. ممکن است از این دیدگاه استفاده کنید تا هزینه های جمع آوری رسم مرزهای شیء را کاهش دهید. یکی دیگر از ویژگی های آموزنده رفتار کاربر، تعداد کلیک هایی است که کاربر برای محدود کردن مرز انجام می دهد. ایده این است که بیشتر شکل های پیچیده نیاز به نقاط بیشتر برای گرفتن این شکل در جزئیات دارد. پیش ببینی شده است که تعداد کلیک های کاربر مربوط به دقت باشد که ممکن است از کاربران جمعیت هنگام درخواست آنها برای رسم مرزهای اشیا انتظار داشته باشید. ابزار طراحی همچنین می تواند موثر باشد.
ما یک مطالعه را برای بررسی رفتار طراحی کارگران پرقدرت در هنگام آشنایی و محتوای تصویر نا آشنا انجام دادیم ، که در تصاویر روزمره و بیومدیکال نشان داده شده است. ما اتصال را بین تکمیل کار دقیق و زمان اتمام کار تحلیل کردیم. همچنین تعداد کلیک های انجام شده کاربران برای رسم مرز با دقتی که این مرز کشیده شده بود را مقایسه کردیم. و آن را برای گسترش تجزیه و تحلیل رفتار جمعیت با ارائه اطلاعات ناآشنا بسیار ارزشمند یافتیم. مشکلاتی را که تا به حال به نظر می رسید نادیده گرفته شده اند،آشکار کردیم و ممکن است نیاز به بازنگری یا گسترش کلی فرضیه های مربوط به رفتار جمعیت داشته باشد. به طور خاص، ما تفاوت های شگفت انگیز در رفتار کاربر بر اساس آشنایی از محتوای تصویر را آشکار کردیم. نتایج ما اطلاعاتی را در مورد چگونگی جمع آوری اطلاعات که ممکن است برای وظیفه تقسیم بندی تصویر استفاده شود ارائه می دهد.
2. روش شناسی تجربی
آزمایش crowdsourcing تمرکز بر وظیفه تقسیم بندی تصویر برای جمع آوری طرحهای crowdsourced از مرزهای اشیاء دارد، ما از ابزار Annotation آنلاین دسترسی آزاد LabelMe استفاده کردیم. آن را به Amazon Mechanical Turk متصل کردیم، یک بازار اینترنتی که ما کاربران را استخدام کردیم که قبلا حداقل 100 کار (HIT) انجام داده بودند و حداقل یک امتیاز تایید 92٪ را نگهداری می کردند. ما تمام HIT های ارسالی را پذیرفتیم. کاربران را با دستورالعمل های جزئی در مراحل کارهای طراحی و تصاویر نشان داده شده آنها از حاشیه نویسی خوب و بد ارائه دادیم. زمان تکمیل کار مکانیزم پایان را به دست آوردیم.
برای ارزیابی کیفیت نقاشی، از نسبت همپوشانی منطقه، یک معیار ارزیابی استاندارد برای اندازه گیری دقت تطابق تقسیم بندی با مرز شیء "واقعی" (استاندارد طلا) استفاده کردیم. نسبت همپوشانی شمار پیکسل های معمولی را برای هر دو ناحیه توضیح داده شده واقعی که در ترکیبی از مناطق هستند شمارش می کند |A∩B/AυB|، (A نشان دهنده مجموعه ای از پیکسل ها در منطقه واقعی است و B نشان دهنده مجموعه ای از پیکسل ها در منطقه یادداشت شده است). رنج نمرات از 0 به 1 با نمره بالاتر بازتاب بیشتر شباهت و دقت بهتر دارد.
ما از دو کتابخانه تصویری معروف رایگان که شامل دو نوع تصاویر هستند استفاده می کنیم: " تصاویر روزانه "از اشیاء آشنا مانند پرندگان و ساختمانها ، و تصاویر زیست پزشکی از محتوای نسبتا نا آشنا، مانند سلول های عضلانی و مقاطع عرضی آئورت قلبی (به ارقام نگاه کنید) علاوه بر داده های تصویری خام، کتابخانه ها شامل، هر تصویر نسخه های چندگانه از مرزهای شیء رسم شده توسط کارشناسان (دانشمندان در مورد تصاویر زیست پزشکی) است. برای به دست آوردن یک استاندارد طلایی تک برای مرزهای شیء "واقعی"، ما این مرزهای تخصصی رسم شده را با استفاده از رای اکثریت در سطح پیکسل (اختصاص یک پیکسل برای تعلق به این شیء زمانی که حداقل نیمی از حاشیه نویسی متخصص پیکسل را به جسم اختصاص می دهد) به هم متصل کردیم.
برای هر کدام از 405 تصویر در مجموعه داده های ما، پنج طرح crowdsourced جمع آوری شده است. هر کاربر مرز شیئ اصلی تصویر را با قرار دادن بسیاری از نقاط کنترل به عنوان she یا he که لازم به نظر می رسد ردیابی می کند. رابط کاربری پیوسته نقاط کنترل را با خطوط مستقیم متصل می کند. این کاربر با کلیک کردن بر روی نقطه شروع، ردیابی مرز را به پایان می رساند. ما به تعداد نقاط کنترل به عنوان "تعداد کلیک های کاربر" اشاره می کنیم. از رای اکثریت در سطح پیکسل استفاده کردیم تا پنج جمعیت جمع شده را به یک طرح کلی جمع آوری کنیم (به عنوان مثال، اختصاص یک پیکسل متعلق به جسم فقط اگر حداقل نیمی از کاربران آن را به جسم اختصاص دادند). ما دقت طرح کلی محاسبه شده را با اندازه گیری توافق آن با طرح استاندارد+ طلایی expert-established با استفاده از معیار همپوشانی متریک تجزیه و تحلیل کردیم.
1. INTRODUCTION
Crowdsourcing platforms empower individuals and businesses to rapidly gather large amounts of human input. The challenge arises how to trust the results obtained from crowdsourced laypersons. Our work is a contribution to the growing exploration of how to successfully leverage large groups of crowdsourced laypersons to collect high-quality image annotation results. Across many fields, methods have been proposed to control the quality of results and minimize human errors. Among them, two main categories can be observed [Allahbakhsh et al. 2013]. The first category of methods is relevant for the design of the crowdsourcing task. By requiring the appropriate qualifications of potential workers [Biewald and Pelt 2010], applying the appropriate visual clues [Sampath et al. 2014] and comprehensive instructions to avoid ambiguity, and showing good and bad examples of the desired result [Kulkarni et al. 2012], requesters can boost their chance of obtaining high-quality responses from the crowd. The second category of quality-control methods can be applied at runtime. The more commonly studied techniques in this category include domain expert review and the use of redundancy, where multiple crowd results are combined into a single final result [Ipeirotis et al. 2010]. A less researched area is how to leverage knowledge about user behavior to evaluate the final result [Rzeszotarski and Kittur 2011].
Collective intelligence has been used to solve labor-intensive computer vision tasks. The focus of our work is the task of delineating boundaries of objects in images (segmentation), which is a critical step for many computer vision tasks, including collecting information in regions of interests, matching objects in different images (registration), following objects over time (tracking), and differentiating between different types of objects (classification).
Image content can affect user behavior and the quality of acquired annotations – a user may require more time to draw complicated object boundaries, e.g., the boundary of a flower versus a box. One may take advantage of this observation in order to reduce the cost of collecting drawings of object boundaries [Carlier et al. 2014; Vijayanarasimhan and Grauman 2009]. Another informative characteristic of user behavior is the number of clicks a user makes to demarcate the boundary. The idea is that more complicated shapes require more points to capture this shape in detail. It has been suggested that the number of user clicks relates to the accuracy one may expect from crowd workers when asking them to draw boundaries of objects [Sorokin and Forsyth 2008]. Drawing tools can also have an effect.
We conducted a study to examine the drawing behavior of crowdsourced workers when given familiar and unfamiliar image content, shown in everyday and biomedical images. We analyzed the connection between accurate task completion and task completion time. We also compared the number of clicks workers performed to draw a boundary with the accuracy with which this boundary was drawn. We found it very valuable to broaden the analysis of crowd behavior by introducing unfamiliar data. We revealed problems that seem to have been overlooked so far and may require rethinking or extending generally held assumptions about crowd behavior. In particular, we revealed surprising differences in user behavior based on familiarity of image content. Our results provide insights into how crowdsourcing may be used for the task of image segmentation.
2. EXPERIMENTAL METHODOLOGY
Our crowdsourcing experiment focused on the image segmentation task [Gurari et al. 2014]. To collect crowdsourced drawings of object boundaries, we used the freely-available online annotation tool LabelMe [Russell et al. 2008]. We connected it to Amazon Mechanical Turk, an Internet marketplace from which we recruited workers who had previously completed at least 100 tasks (HITs) and maintained at least a 92% approval rating. We accepted all submitted HITs. We provided workers with detailed instructions on the steps of the drawing tasks and showed them pictures of good and bad annotations. We obtained task completion times from Mechanical Turk.
To evaluate drawing quality, we used the region overlap ratio, a standard evaluation metric, to measure how closely a segmentation matches the “true” (gold standard) object boundary. The overlap ratio counts the number of pixels common to both the annotated and true regions that are in the combination of regions (i.e., |A∩B| |A∪B| , where A represents the set of pixels in the true region and B represents the set of pixels in the annotated region). Scores range from 0 to 1 with higher scores reflecting greater similarity and so better accuracy.
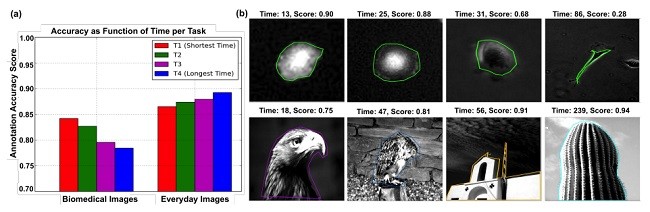
We used two freely available benchmark image libraries that contain two types of images: “everyday images” of familiar objects, e.g., birds and buildings [Alpert et al. 2007], and biomedical images of relatively unfamiliar content, e.g., muscle cells and cross sections of the heart aorta [Gurari et al. 2014] (see figures). In addition to raw image data, the libraries contain, per image, multiple versions of object boundaries drawn by experts (scientists in the case of the biomedical images). To obtain a single gold standard for the “true” object boundaries, we combined these expert-drawn boundaries using the pixel-level majority vote (assign a pixel to belong to the object when at least half of the expert annotations assign the pixel to the object)
We collected five crowdsourced drawings for each of the 405 images in our data set. Each worker traced the boundary of the main object of the image by placing as many control points as he or she deemed necessary. The user interface connected the sequence of control points with straight lines. The worker finished tracing the boundary by clicking on the start point. We refer to the number of control points as the “number of user clicks.” We used a pixel-level majority vote to combine the five crowdcollected outlines into a single outline (i.e., assign a pixel to belong to the object only if at least half of the workers assigned it to the object). We analyzed the accuracy of the computed outline by measuring its agreement with the expert-established gold standard outline using the overlap ratio metric.
1. معرفی
2. روش شناسی تجربی
3. نتایج
3.1 دقت به عنوان عملکرد زمان تکمیل
3.2 دقت به عنوان یک عملکرد از کلیک های کاربر
4. بحث و نتیجه گیری
1. INTRODUCTION
2. EXPERIMENTAL METHODOLOGY
3. RESULTS
3.1 Accuracy as a Function of Completion Time
3.2 Accuracy as a Function of User Clicks
4. DISCUSSION AND CONCLUSIONS
REFERENCES